Log Management
The Log Management page is used to view, filter, and manage system operation logs. It supports filtering log files by service, level, and date, and provides view, clean, and delete operations.
1. Access Log Management
1.1 Open Log Management Page
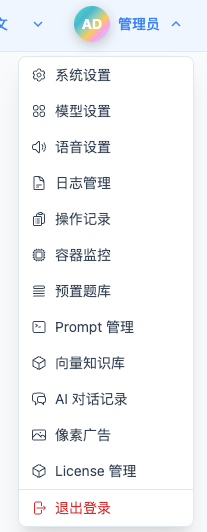
Click "Log Management" in the top dropdown menu to enter the Log Management page.
2. Filter Logs
2.1 Filter by Project
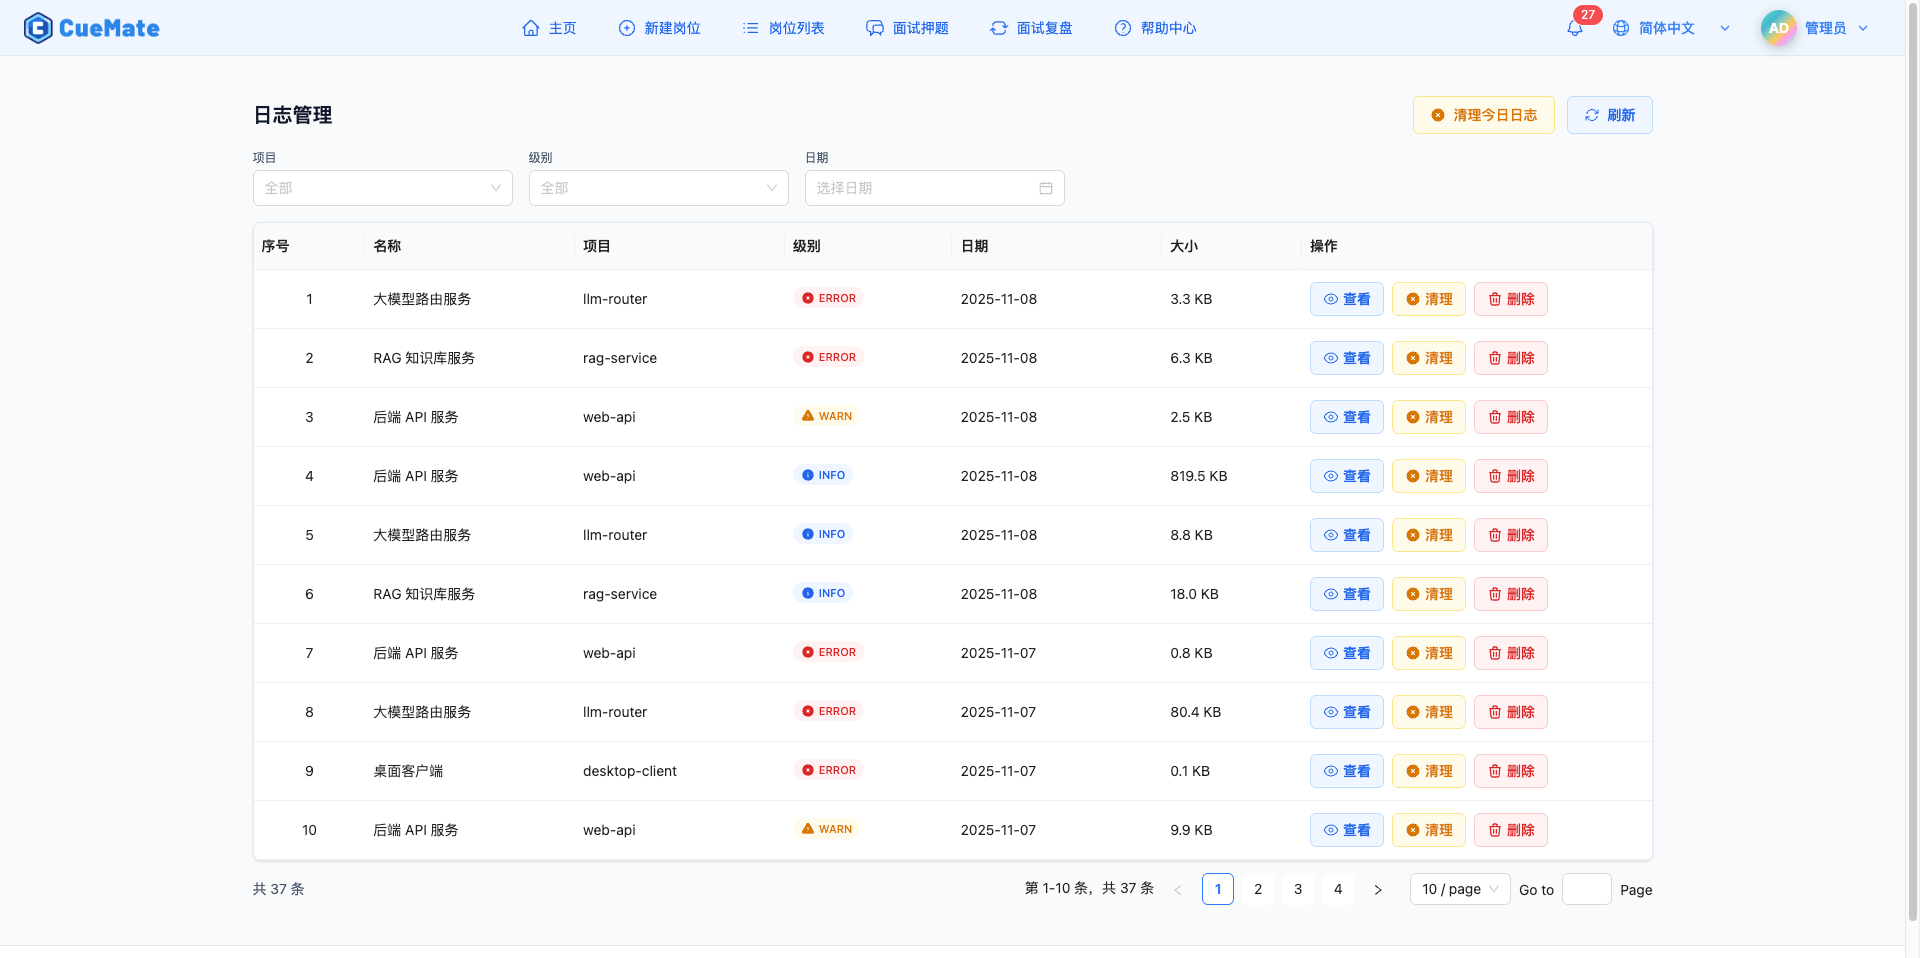
Select the service to view in the "Project" dropdown.
Supported Services:
- Backend API Service (web-api): Web API service logs
- LLM Router Service (llm-router): LLM routing service logs
- RAG Knowledge Base Service (rag-service): Vector knowledge base service logs
- Desktop Client (desktop-client): Electron desktop application logs
Filter Notes:
- Select "All" to show logs from all services
- Select specific service to show only that service's logs
- Switching services automatically resets to page 1
Use Cases:
- Troubleshoot issues with specific services
- View running status of a service
- Analyze call relationships between services
2.2 Filter by Level
Select the log level to view in the "Level" dropdown.
Supported Levels:
- DEBUG: Debug information, detailed program execution process
- INFO: General information, normal business flow records
- WARN: Warning information, potential issues that don't affect operation
- ERROR: Error information, program exceptions and errors
Filter Notes:
- Select "All" to show logs of all levels
- Select specific level to show only that level's logs
- Levels display with different color labels:
- DEBUG: Gray
- INFO: Blue
- WARN: Yellow
- ERROR: Red
Use Cases:
- View ERROR logs to quickly locate errors
- View WARN logs to discover potential issues
- View INFO logs to understand business flow
- View DEBUG logs for detailed debugging
2.3 Filter by Date
Click the "Date" picker to select the log date to view.
Date Selection:
- Click date input to open calendar picker
- Select specific date to show only that date's logs
- Clear date to show logs from all dates
Use Cases:
- View system operation on a specific date
- Trace back to when historical issues occurred
- Analyze system performance during a time period
2.4 Combined Filtering
You can use project, level, and date filters simultaneously for combined filtering.
Combination Examples:
- Project: web-api + Level: ERROR → View all error logs from Web API service
- Project: llm-router + Date: 2026-01-15 → View all logs from LLM Router service on 2026-01-15
- Level: WARN + Date: 2026-01-15 → View warning logs from all services on 2026-01-15
- Project: rag-service + Level: ERROR + Date: 2026-01-15 → Precisely locate error logs for specific service and date
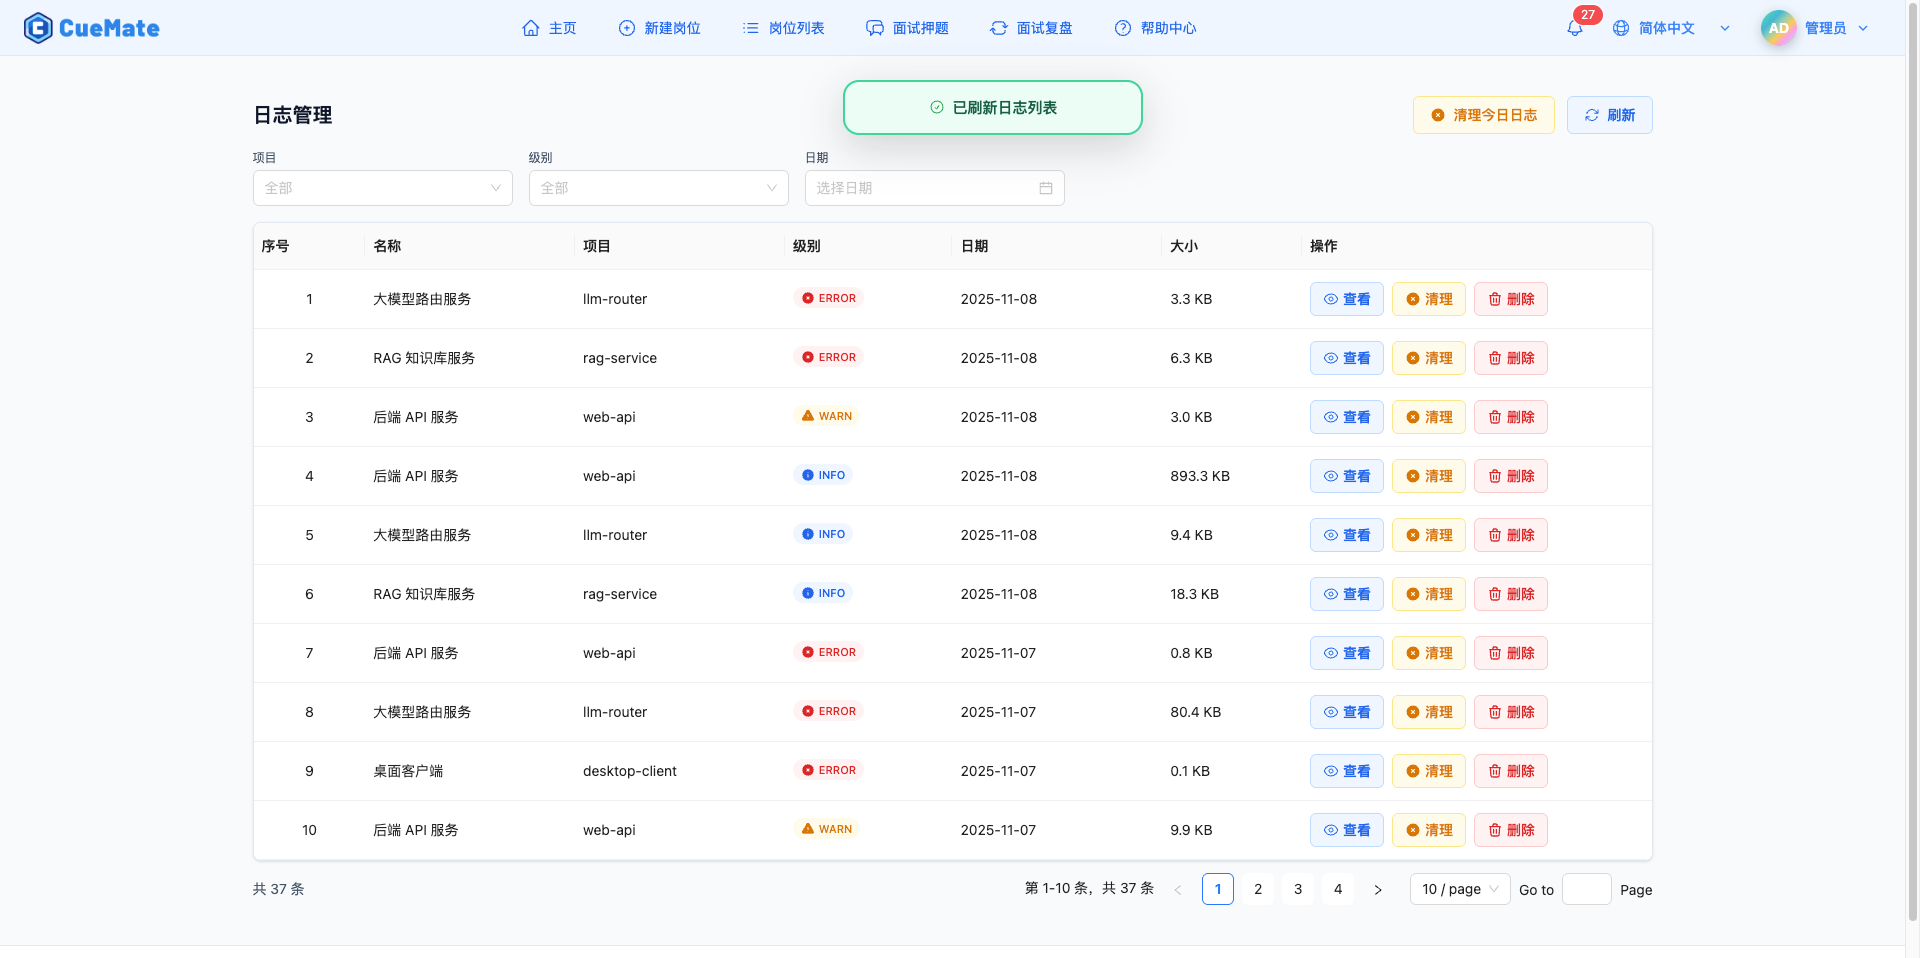
3. Log List
3.1 List Field Descriptions
The log list displays in table format with the following fields:

Number:
- Sequence number on current page
- Auto-calculated, starting from 1
Name:
- Service's display name
- For quick identification of service
Project:
- Service's English identifier
- Used for technical troubleshooting and log location
Level:
- Log level label
- With icon and color for quick identification
- DEBUG (gray), INFO (blue), WARN (yellow), ERROR (red)
Date:
- Log file date
- Format: YYYY-MM-DD (e.g., 2026-01-15)
Size:
- Log file size
- Unit: KB
- Shows one decimal place (e.g., 125.6 KB)
Actions:
- View button (blue): Open log viewer to see complete log content
- Clean button (yellow): Clear log file content without deleting file
- Delete button (red): Completely delete log file
3.2 Pagination
Pagination Controls:
- Bottom shows total records (e.g., "45 total")
- Supports switching items per page: 10/20/50/100
- Supports page navigation, auto-calculates total pages
- Switching items per page automatically resets to page 1
Use Cases:
- Use pagination when there are many logs
- Adjust items per page to quickly browse large amounts of logs
- Jump to specific page via page number
4. View Logs
4.1 Open Log Viewer
Click the "View" button in the log list to open the log viewer side panel.
Viewer Features:
- Right side panel, 85% of screen width
- Displays complete log file content
- Supports scrolling for long logs
- Shows log level, service name, date, total lines
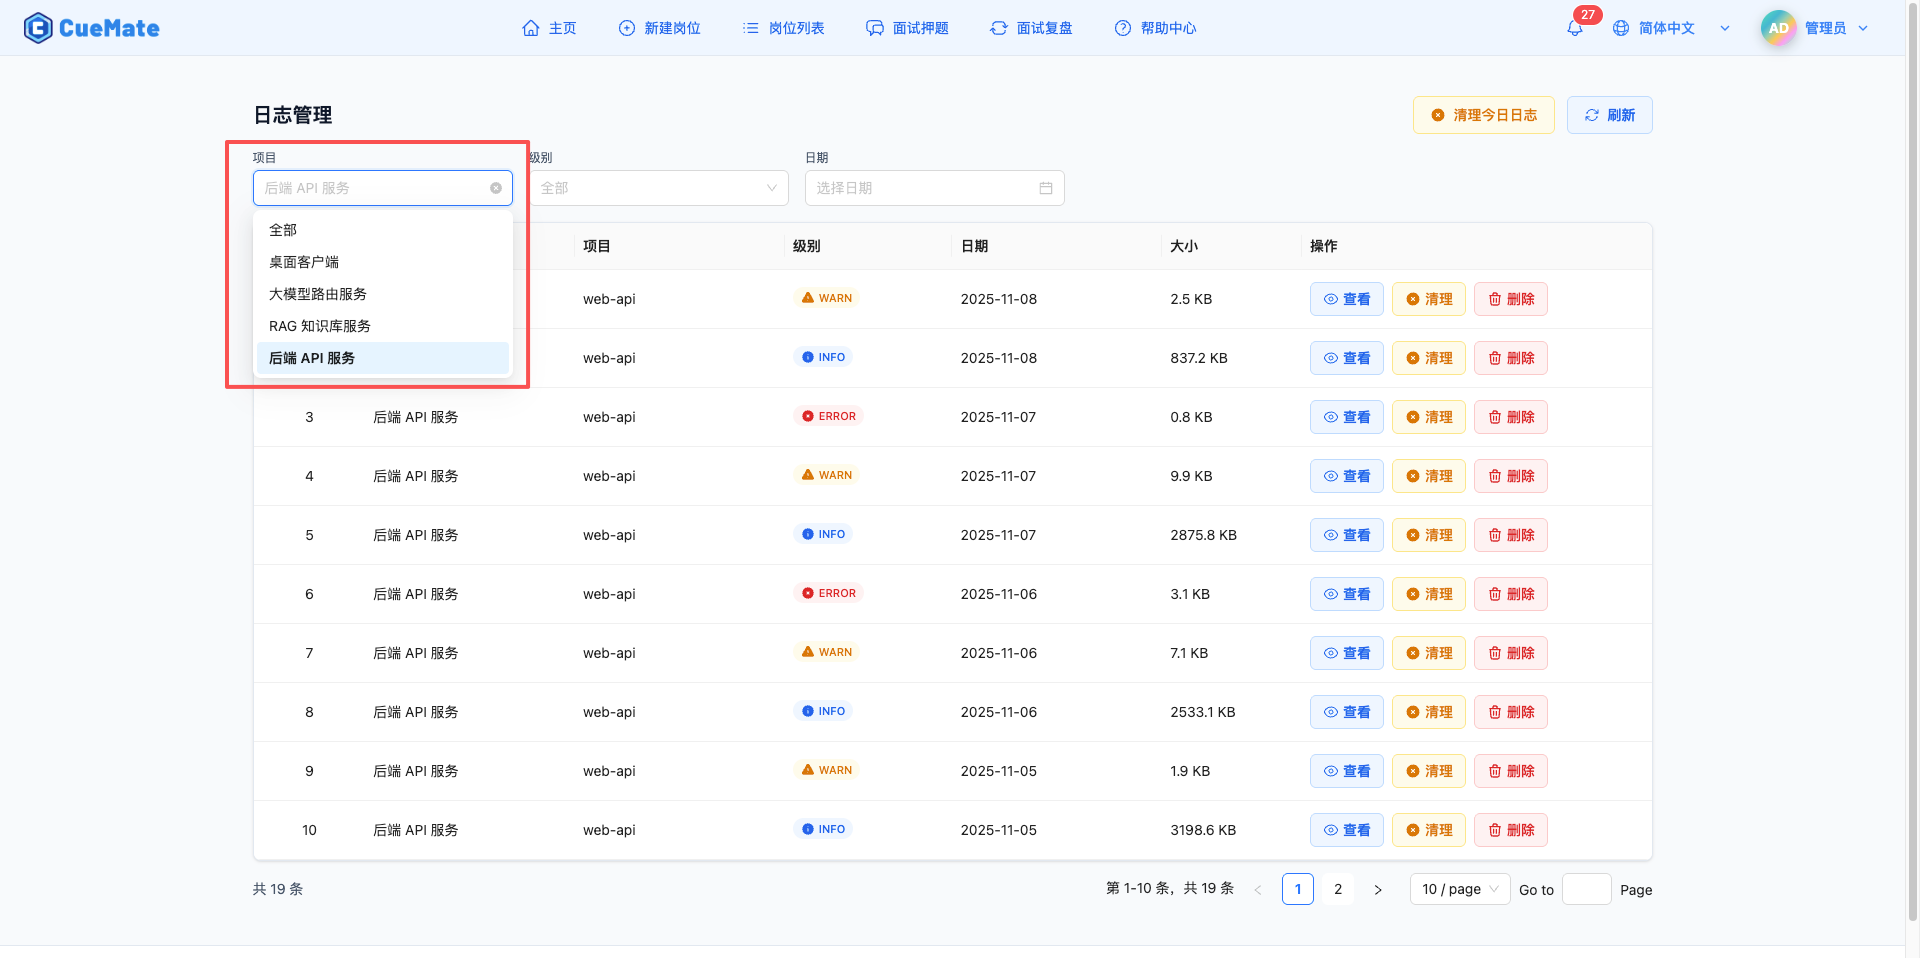
4.2 Log Viewer Interface
Top Title Area:
- Service icon and display name
- Log level label (different colors)
- Date display
- Total line count (e.g., "123 log lines")
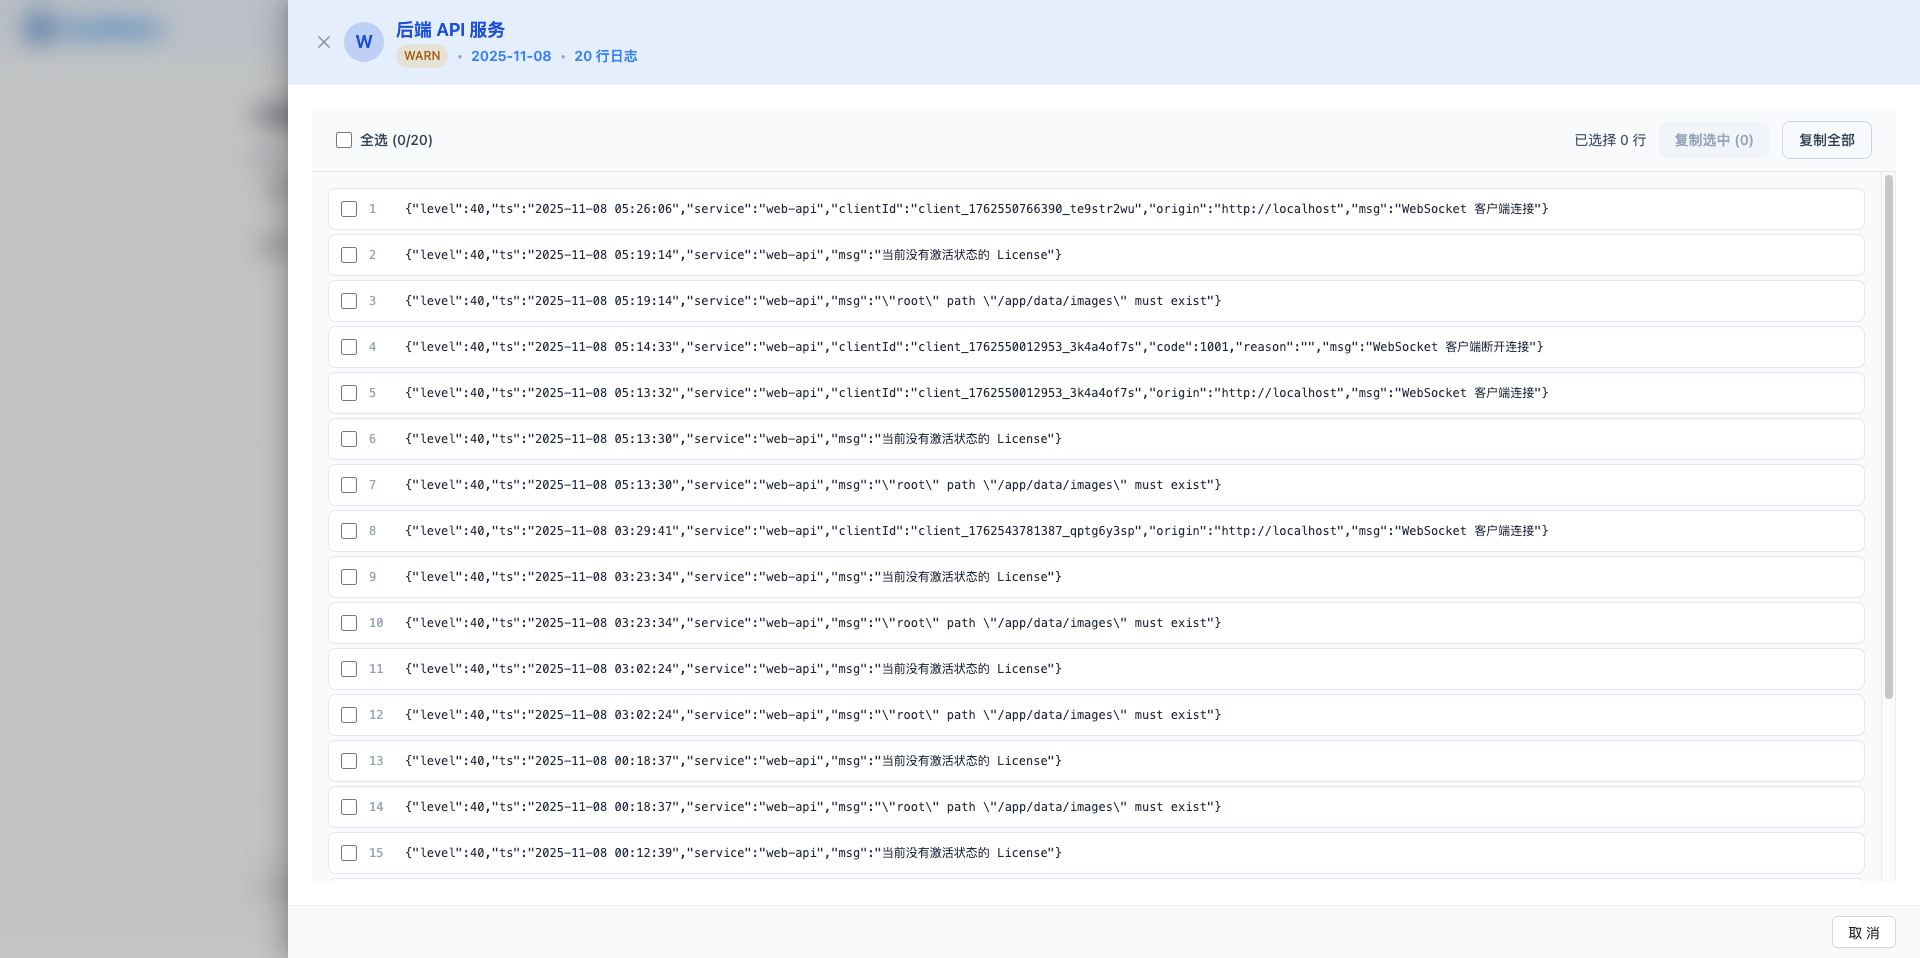
Toolbar:
- Select all checkbox: Select/deselect all log lines
- Selected count display (e.g., "5 lines selected")
- "Copy Selected" button: Copy selected log lines to clipboard
- "Copy All" button: Copy all log content to clipboard
Log Content Area:
- Each log line displays as individual card
- Left checkbox for selecting that line
- Line number display (starting from 1)
- Log content display:
- JSON format logs use monospace font and syntax highlighting
- Plain text logs use normal font
- Hover shows selection hint
- Click log line to toggle selection
4.3 Select and Copy Logs
Single Line Selection:
- Click log line's checkbox or the entire line
- Selected line shows blue highlight background
- Click again to deselect
Multi-Line Selection:
- Click multiple log lines sequentially
- All selected lines show blue highlight background
- Toolbar shows selected count
Select All:
- Click "Select All" checkbox in toolbar
- All log lines are selected
- Click again to deselect all
Copy Selected Content:
- Select one or more log lines
- Click "Copy Selected" button
- Selected log content copied to clipboard
- Shows success message (e.g., "5 log lines copied to clipboard")
Copy All Content:
- Click "Copy All" button
- All log content copied to clipboard
- Shows success message "All logs copied to clipboard"
Use Cases:
- Select key log lines to copy for issue reports
- Copy error stack traces to send to technical support
- Export specific log snippets for analysis
- Copy all log content for local analysis
4.4 Close Log Viewer
Click the "×" button in top right corner or press ESC to close log viewer.
5. Clean Logs
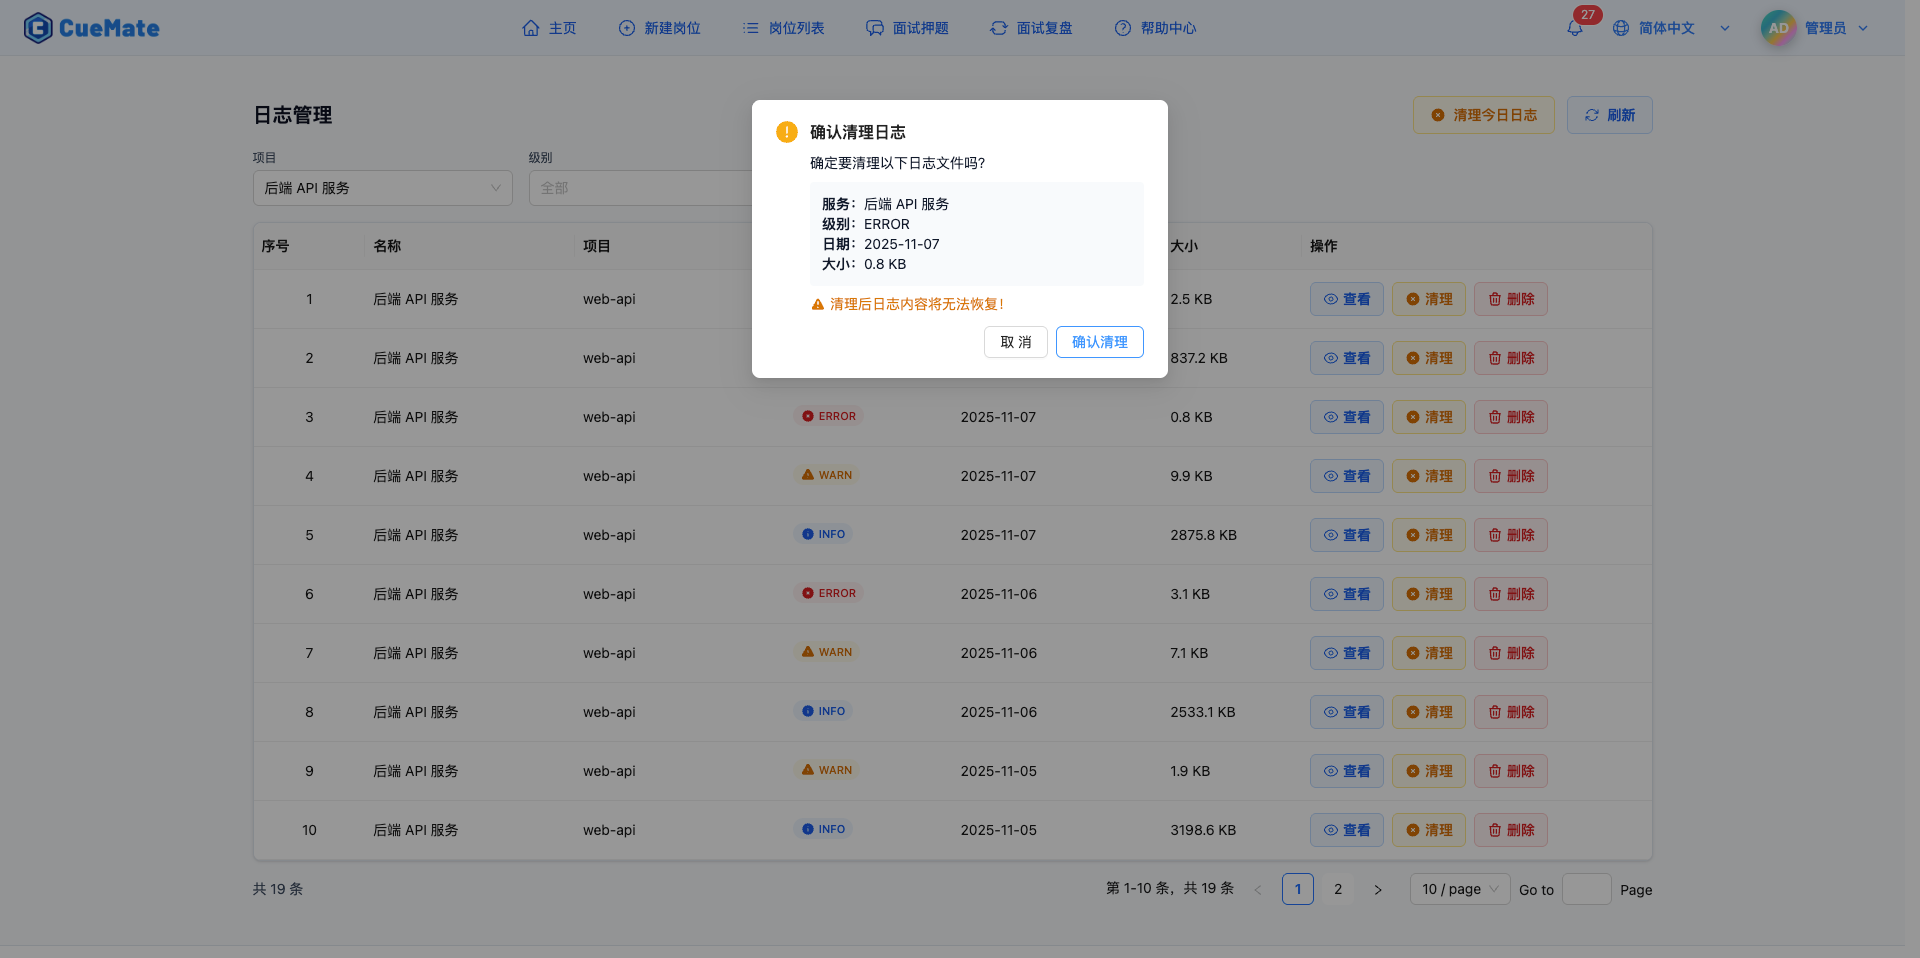
5.1 Clean Single Log File
Click the "Clean" button in the log list to clear that log file's content.
Clean Confirmation Dialog:
- Shows log file information to clean:
- Service name
- Log level
- Date
- File size
- Yellow warning: "Log content cannot be recovered after cleaning!"
- Two action buttons:
- "Confirm Clean": Execute clean operation
- "Cancel": Abort cleaning
Clean Results:
- Clean success shows message "Log cleaned successfully"
- Log file content is cleared, but file itself is preserved
- File size becomes 0 or near 0 KB
- List auto-refreshes to show updated file size
Use Cases:
- Log file too large, need to free storage space
- Clear processed error logs
- Periodically clean historical logs no longer needed
- Keep file structure but clear content
Important Notes:
- Clean operation is irreversible, confirm content is not needed before proceeding
- Clean only affects file content, does not delete file itself
- Recommend cleaning logs after troubleshooting is complete
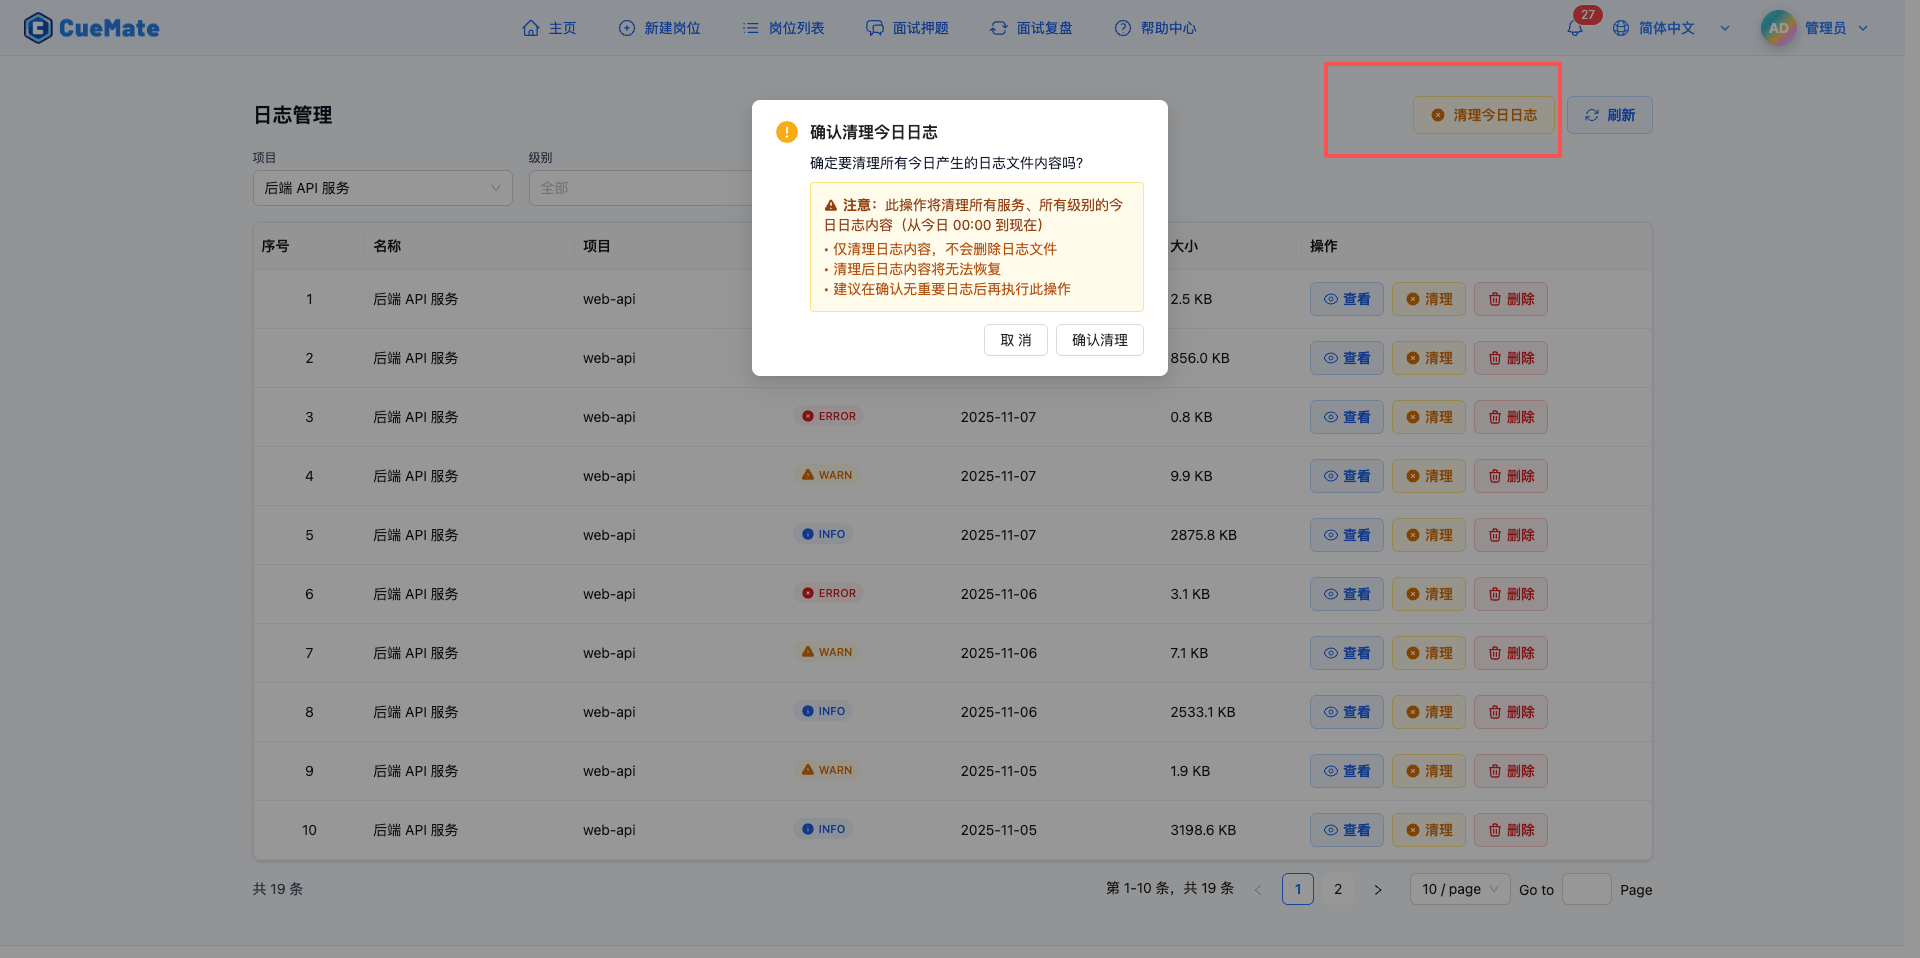
5.2 Clean Today's Logs
Click the "Clean Today's Logs" button at top to batch clear all log file contents generated today.
Clean Confirmation Dialog:
- Yellow warning area shows cleaning scope:
- This operation will clean today's log content from all services and all levels
- Time range: From today 00:00 to now
- Only cleans log content, will not delete log files
- Log content cannot be recovered after cleaning
- Recommend confirming no important logs before executing
- Two action buttons:
- "Confirm Clean": Execute batch clean
- "Cancel": Abort cleaning
Clean Results:
- Clean success shows message (e.g., "Today's logs cleaned successfully, 12 log files cleaned")
- All today's log file contents are cleared
- List auto-refreshes to show updated status
Use Cases:
- Clean temporary logs at end of each workday
- Clean test logs after testing is complete
- Regular maintenance to free storage space
- Batch clean today's logs no longer needed
Important Notes:
- This operation affects today's logs from all services, use with caution
- Recommend checking if any important logs need to be kept before cleaning
- If only need to clean specific service or level logs, use single file clean feature
6. Delete Logs
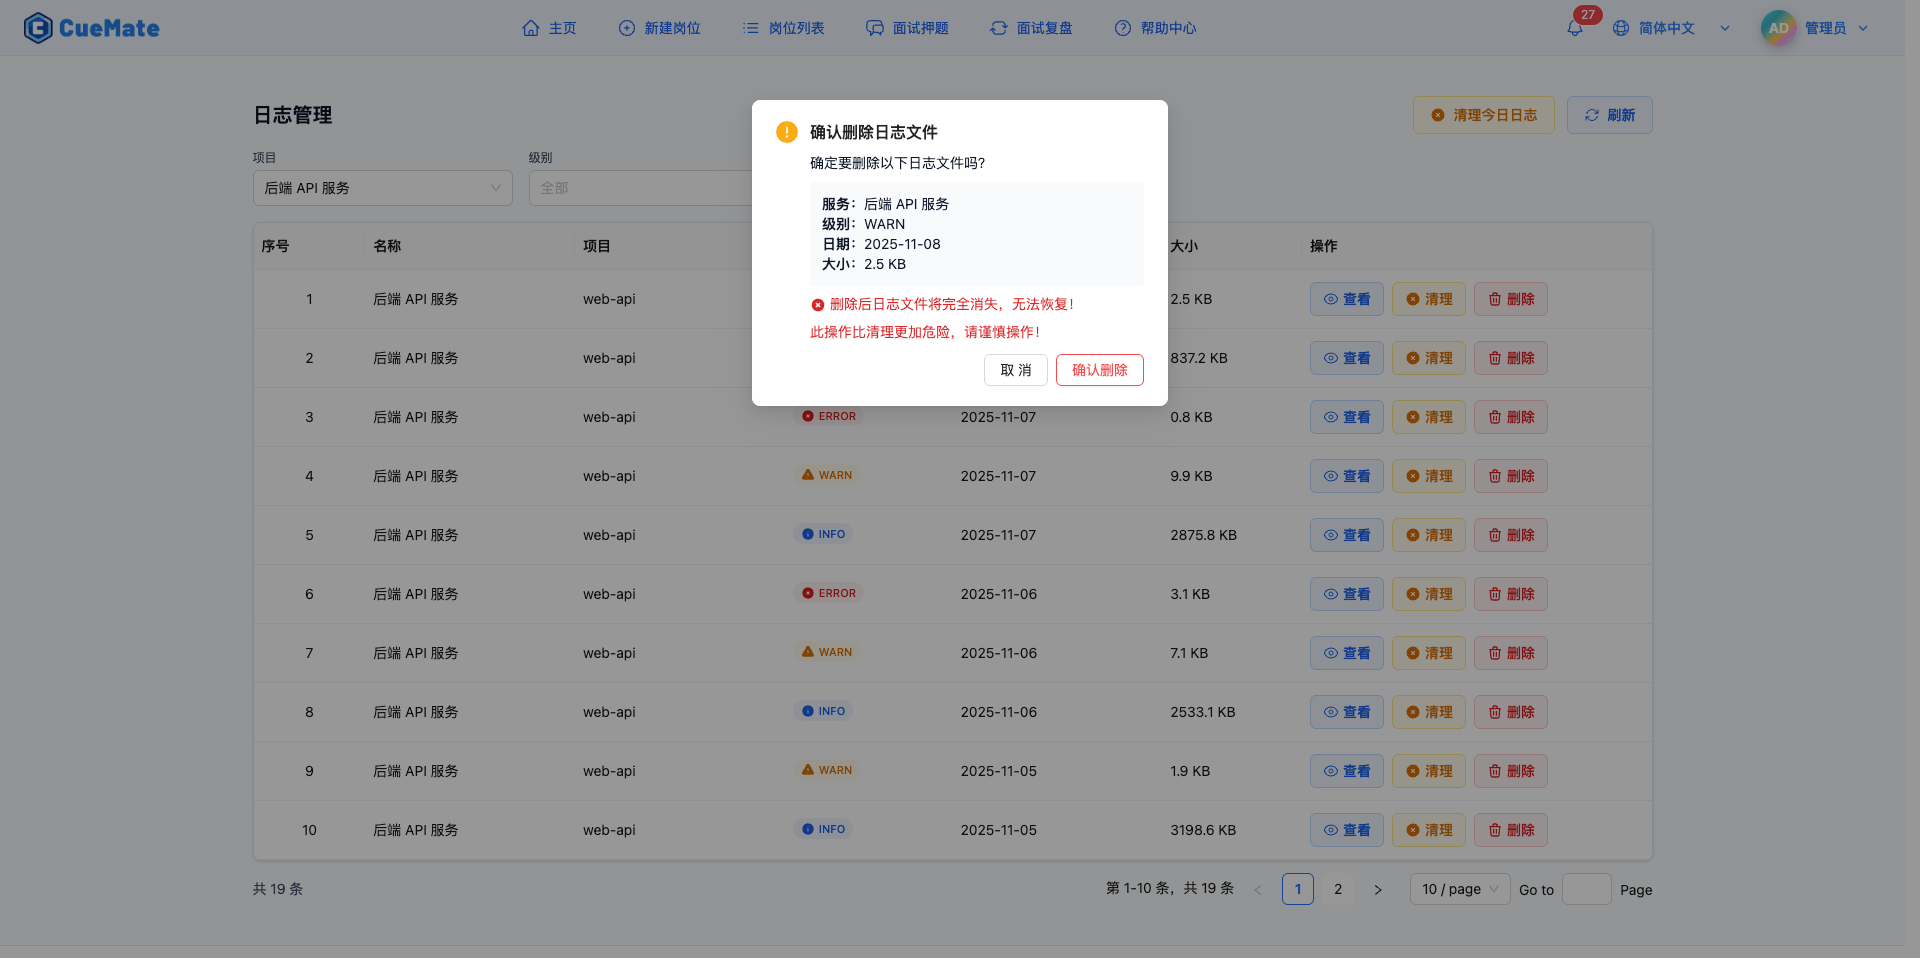
6.1 Delete Log File
Click the "Delete" button in the log list to completely delete that log file.
Delete Confirmation Dialog:
- Shows log file information to delete:
- Service name
- Log level
- Date
- File size
- Red danger warning:
- "Log file will completely disappear after deletion, cannot be recovered!"
- "This operation is more dangerous than cleaning, please proceed with caution!"
- Two action buttons:
- "Confirm Delete" (red danger button): Execute delete operation
- "Cancel": Abort deletion
Delete Results:
- Delete success shows message "Log file deleted"
- Log file completely disappears, cannot be recovered
- List auto-refreshes, that log file no longer displays
Clean vs Delete:
| Operation | File | Content | Recovery | Danger Level |
|---|---|---|---|---|
| Clean | Preserved | Cleared | Cannot recover | Medium |
| Delete | Deleted | Deleted | Cannot recover | High |
Use Cases:
- Confirm a log file is no longer needed
- Completely clean historical logs to free storage space
- Delete log files containing sensitive information
- Delete local log files after archiving
Important Notes:
- Delete operation is irreversible, make sure log file is not needed
- Delete is more dangerous than clean, use with caution
- Recommend first cleaning log content, confirm no impact, then delete file
- For logs that may be used for troubleshooting, recommend exporting backup before deleting
7. Refresh Log List
7.1 Manual Refresh
Click the "Refresh" button at top to reload log list and service list.
Refresh Content:
- Re-fetch service list
- Reload log file list
- Update file size information
- Update file modification time
Use Cases:
- New log files generated in background
- After executing clean or delete operations
- Confirm results of other operations
- Periodically refresh to view latest status
7.2 Auto Refresh
Operations That Trigger Auto Refresh:
- After cleaning single log file
- After deleting log file
- After cleaning today's logs
- After switching filter conditions (project/level/date)
- After switching pages
8. Log File Storage
8.1 Log Storage Location
macOS System:
~/Library/Application Support/cuemate-desktop-client/data/logs/{service}/{date}/{level}.logPath Description:
{service}: Service name (web-api/llm-router/rag-service/cuemate-asr/desktop-client){date}: Date (YYYY-MM-DD){level}.log: Log filename (debug.log/info.log/warn.log/error.log)
Example Path:
~/Library/Application Support/cuemate-desktop-client/data/logs/web-api/2026-01-15/error.log8.2 Log File Format
JSON Format Log:
{"level":"error","time":"2026-01-15T10:30:45.123Z","service":"web-api","message":"Database connection failed","stack":"..."}Text Format Log:
[2026-01-15 10:30:45] ERROR: Database connection failed8.3 Log Rotation and Archiving
Log Rotation Policy:
- Log files split by date
- New log files generated each day
- Old log files automatically archived
Log Retention Period:
- Default retention 30 days
- Can be adjusted in system settings
- Logs exceeding retention period are automatically deleted
9. Best Practices
9.1 Daily Maintenance
Recommended Actions:
- Check ERROR and WARN logs weekly
- Periodically clean historical logs not needed
- Keep recent 7-30 days of logs for troubleshooting
- View logs promptly when issues occur to identify causes
9.2 Troubleshooting Process
Troubleshooting Steps:
- Determine time and related service when issue occurred
- Use filter conditions to locate relevant log files
- Open log viewer to see complete log content
- Search for key error messages or stack traces
- Analyze error cause, develop solution
- After fixing, verify logs return to normal
Troubleshooting Tips:
- First check ERROR level logs
- Combine with WARN level logs to analyze potential issues
- Compare normal logs with abnormal logs
- Track request ID to locate complete call chain
9.3 Log Cleaning Strategy
Cleaning Recommendations:
- Clean related logs after troubleshooting is complete
- Clean DEBUG and INFO logs weekly
- Clean WARN logs monthly
- ERROR logs recommend keeping 30+ days
- Export important log content before cleaning
Cleaning Priority:
- High priority: DEBUG logs (large space, low value)
- Medium priority: INFO and WARN logs (clean periodically)
- Low priority: ERROR logs (keep longer)
9.4 Log Analysis
Analysis Dimensions:
- Error frequency: Count ERROR log occurrence frequency
- Error types: Categorize different error messages
- Service health: Compare log level distribution across services
- Time trends: Analyze log changes across different time periods
Analysis Tools:
- Use log viewer's select and copy features
- Export logs locally for statistical analysis
- Use filter conditions to quickly locate key logs
- Combine with container monitoring to view service status
10. FAQ
10.1 Log File Too Large
Issue: A log file exceeds 100 MB, opens very slowly.
Solutions:
- Use "Clean" feature to clear log content
- Or use "Delete" feature to delete file
- Check if there's an issue with too frequent log output
- Adjust log level to reduce unnecessary log output
10.2 Cannot Find Log File
Issue: List is empty after filtering, cannot find desired log file.
Solutions:
- Check if date selection is correct
- Try clearing all filter conditions to view all logs
- Confirm service had log output on that date
- Check if log storage directory is normal
10.3 Log Viewer Won't Open
Issue: Click "View" button, log viewer doesn't open or shows blank.
Solutions:
- Check if log file exists
- Check if log file permissions are normal
- Try refreshing page then reopen
- Check browser console for error messages
10.4 Copy Log Failed
Issue: Click "Copy Selected" or "Copy All" button, shows copy failed.
Solutions:
- Check if browser allows clipboard access
- Try manually selecting log content to copy
- Confirm selected log lines are not empty
- Check browser permission settings
Related Pages
- Operation Logs - View user operation records
- Container Monitoring - View Docker service status
- System Settings - Configure system parameters