#Container monitoring
The container monitoring page is used to monitor and manage the running status of local Docker containers. Through this page, you can view the running status of all backend service containers in real time, view container logs, and restart containers.
1. Enter container monitoring
1.1 Open the container monitoring page
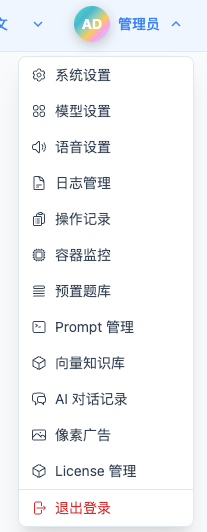
Click "Container Monitoring" in the top drop-down menu to enter the container monitoring page.
2. View container statistics
2.1 Statistics Card
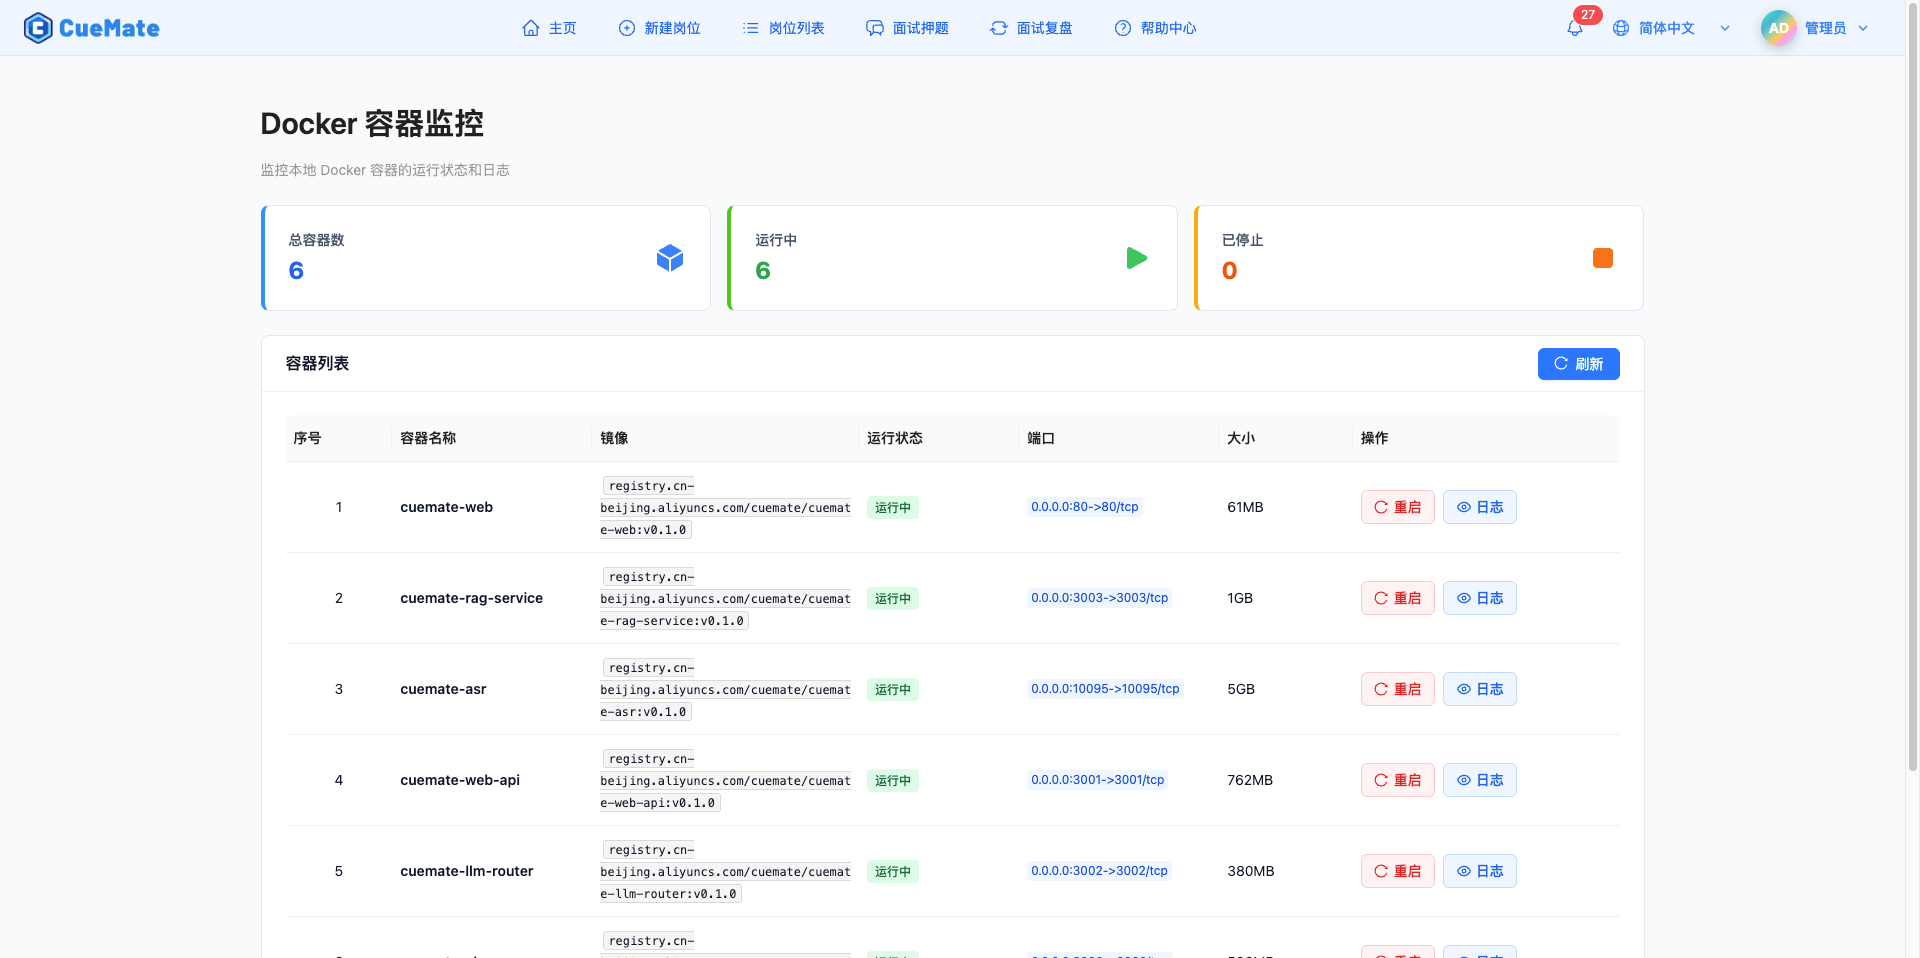
Three statistics cards are displayed at the top of the page, showing an overview of the container:

Total number of containers:
- Displays the total number of all Docker containers in the system
- Includes running and stopped containers
- Blue icon logo
Running:
- Displays the number of currently running containers
- Green icon logo -Containers in a healthy state should all be running
Stopped:
- Shows the number of stopped or exited containers
- Orange icon logo
- Need to pay attention to whether the stopped container is normal
3. View container list
3.1 List field description
The container list is displayed in table form and contains the following fields:

| Field | Description |
|---|---|
| Index | Row number in the current page, auto-calculated starting from 1 |
| Container Name | Name of the Docker container, usually the service name (e.g., cuemate-web-api, cuemate-asr), displayed in bold for easy identification |
| Image | Docker image name and version used by the container, displayed in code format Example: registry.cn-beijing.aliyuncs.com/cuemate/cuemate-web-api:v0.1.1 |
| Status | Current running status of the container, displayed with different colored labels: • Running: Green label • Stopped: Orange label • Exited: Red label • Created: Blue label • Paused: Purple label |
| Ports | Port mapping information of the container, showing host port to container port mapping If there are more than 2 ports, "+N" is displayed to indicate more ports Example: 3001:3001, 10095:10095 |
| Size | Disk space occupied by the container, including container layer and writable layer size |
| Actions | • Restart: Restart this container • Logs: Open log side panel to view container logs |
3.2 Paging function
Pagination controls are available at the bottom of the list:
Function description:
- Display current page number and total number of pages
- Show total number of records
- Optional display quantity per page: 10, 20, 50, 100 items
- Switch the page number to see more containers
3.3 Automatic refresh
The system automatically refreshes the container list every 30 seconds to ensure that the latest container status is displayed.
4. Restart the container
4.1 Restart a single container
Click the "Restart" button in the container list to restart the specified container.
Restart process:
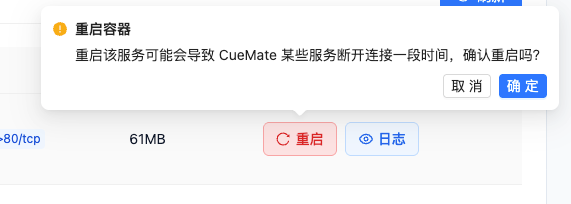
- Click the "Restart" button of the target container
- A confirmation dialog box pops up: "Restarting this service may cause some CueMate services to be disconnected for a period of time. Are you sure to restart?"
- Click "OK" to perform the restart
- Display a full-screen loading prompt: "Restarting the container, please wait..."
- After the restart is completed, the prompt "Container restarted successfully" will be displayed.
- The list automatically refreshes to show the latest status
Note:
- Restarting the container will cause a brief service interruption
- The restart process usually takes a few seconds to tens of seconds
- After restarting, the container will maintain its original configuration and data
- Please make sure no important operations are in progress before restarting
Applicable scenarios:
- An abnormality occurs in the container and needs to be restarted and recovered.
- Configuration needs to be restarted after updating to take effect
- Memory leak requires restarting to release resources
5. View container logs
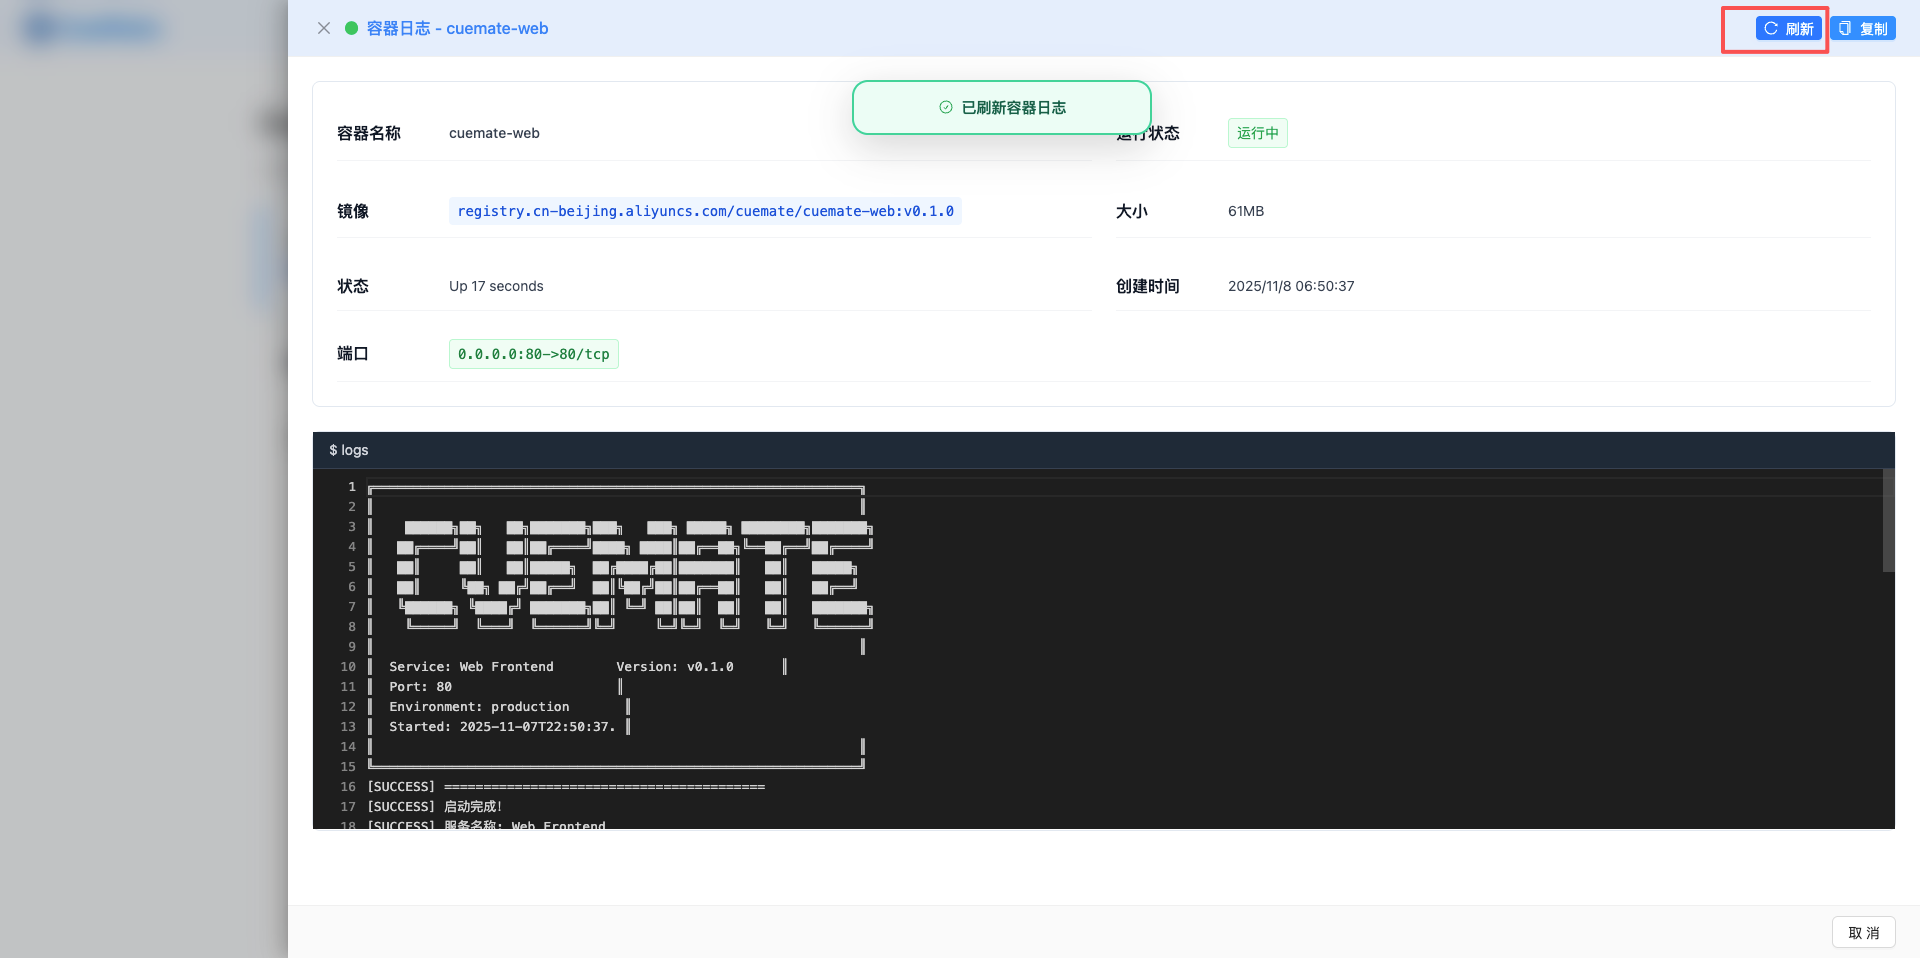
5.1 Open the log side pop-up box
Click the "Log" button in the container list to open the container log pop-up box.
Pop-up box features:
- The pop-up box on the right side takes up 85% of the screen width
- Show full details and log content of the container -Support real-time viewing and refreshing of logs
5.2 Container information
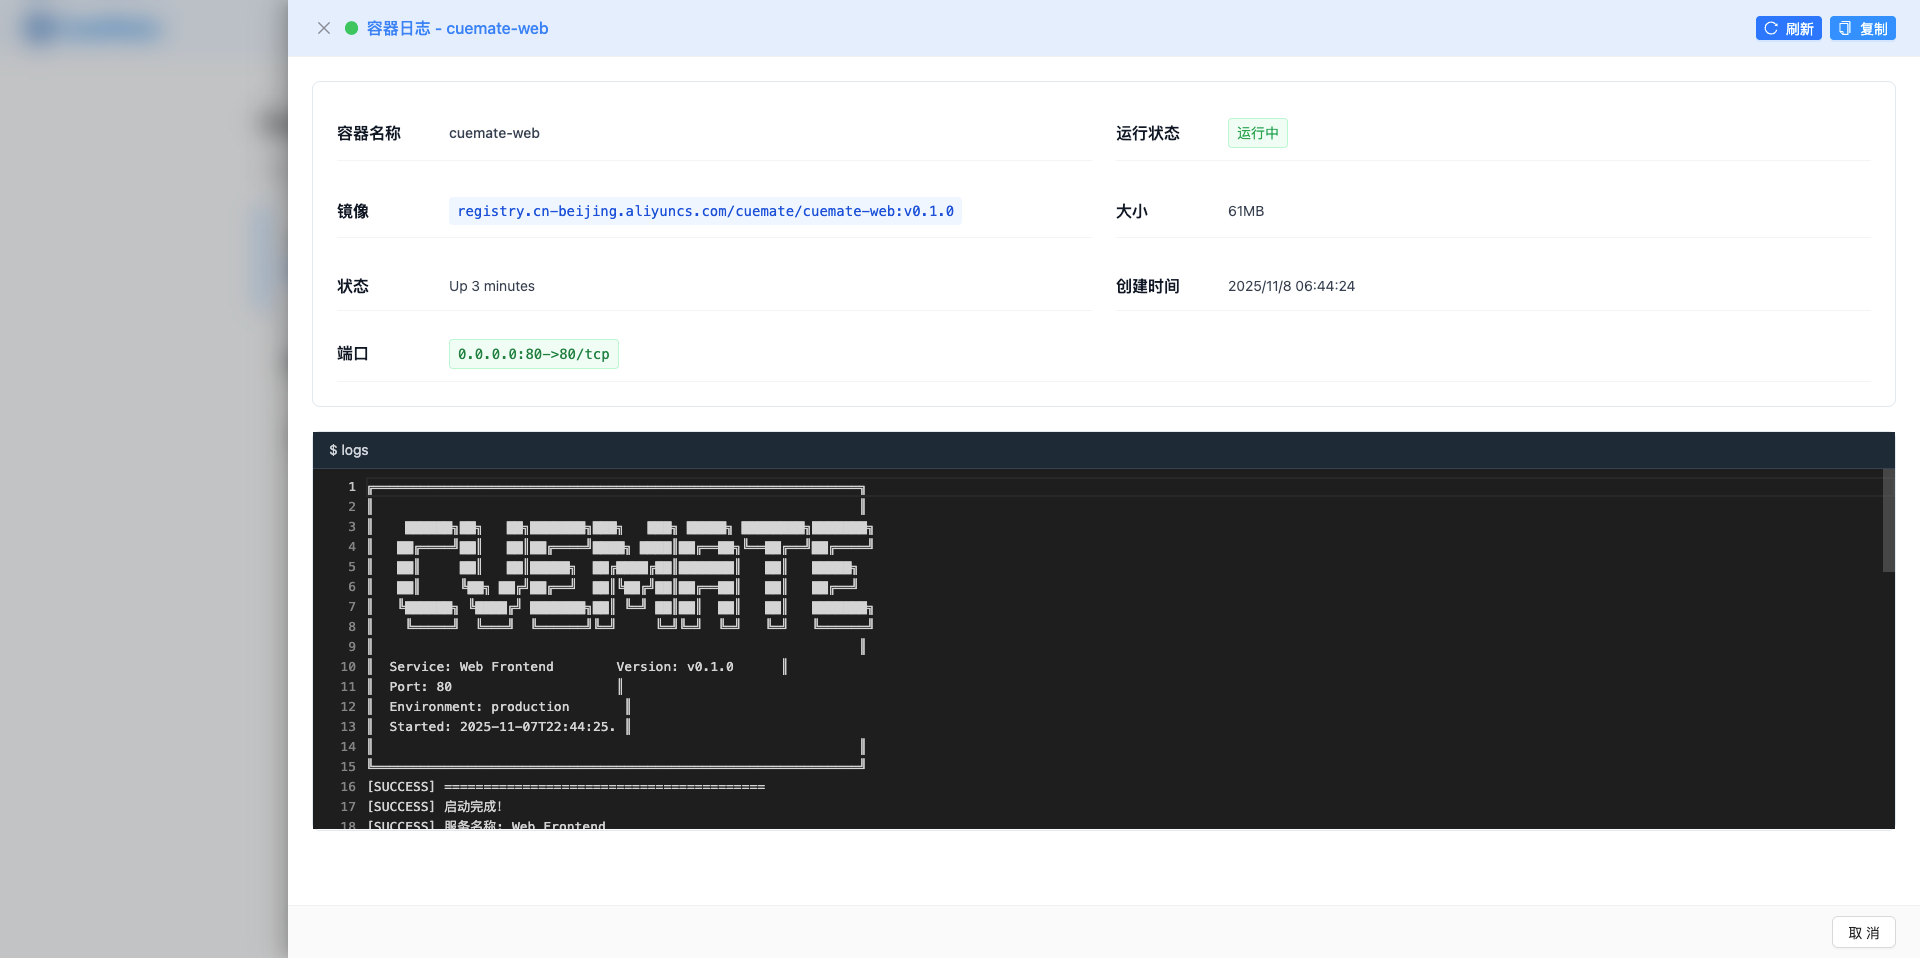
The top of the log pop-up box displays container details:
Basic information:
- Container name
- Running status (with color label)
- Image name and version
- Container size
- Status description
- Creation time (local time format)
Port information:
- Show all port mappings
- Displayed as a green label
- Format: host port: container port
5.3 Log content
The running log of the container is displayed below the pop-up box:
Log Viewer Features:
- Fixed height 400px, support scrolling
- Dark theme background (white text on black background)
- Automatically wrap the display
- Show full log output
Log source:
- The standard output (stdout) of the Docker container
- Docker container’s standard error (stderr)
- Get the latest log content in real time
6. Log operation
6.1 Refresh log
Click the "Refresh" button in the upper right corner of the log pop-up box to re-obtain the latest container logs.
Refresh function:
- Request container log content
- Get the latest log output
- Show loading status when refreshing
- Automatically update the log display after the refresh is completed
Usage Scenario:
- View the latest log output
- Real-time logs are needed when troubleshooting problems
- Verify whether the operation takes effect
6.2 Replication log
Click the "Copy" button in the upper right corner of the log pop-up box to copy the log content to the clipboard.
Copy function:
- Copy all log contents with one click
- Use modern clipboard API (navigator.clipboard)
- Automatic downgrade to legacy copy method (compatible with older browsers)
- After successful copying, the prompt "The log content has been copied to the clipboard" will be displayed.
Usage Scenario:
- Save log content locally
- Share logs with technical support
- Analyze logs in other tools
- Record the troubleshooting process
7. Refresh container list
7.1 Manual refresh
Click the "Refresh" button in the upper right corner of the container list to manually refresh the container list.
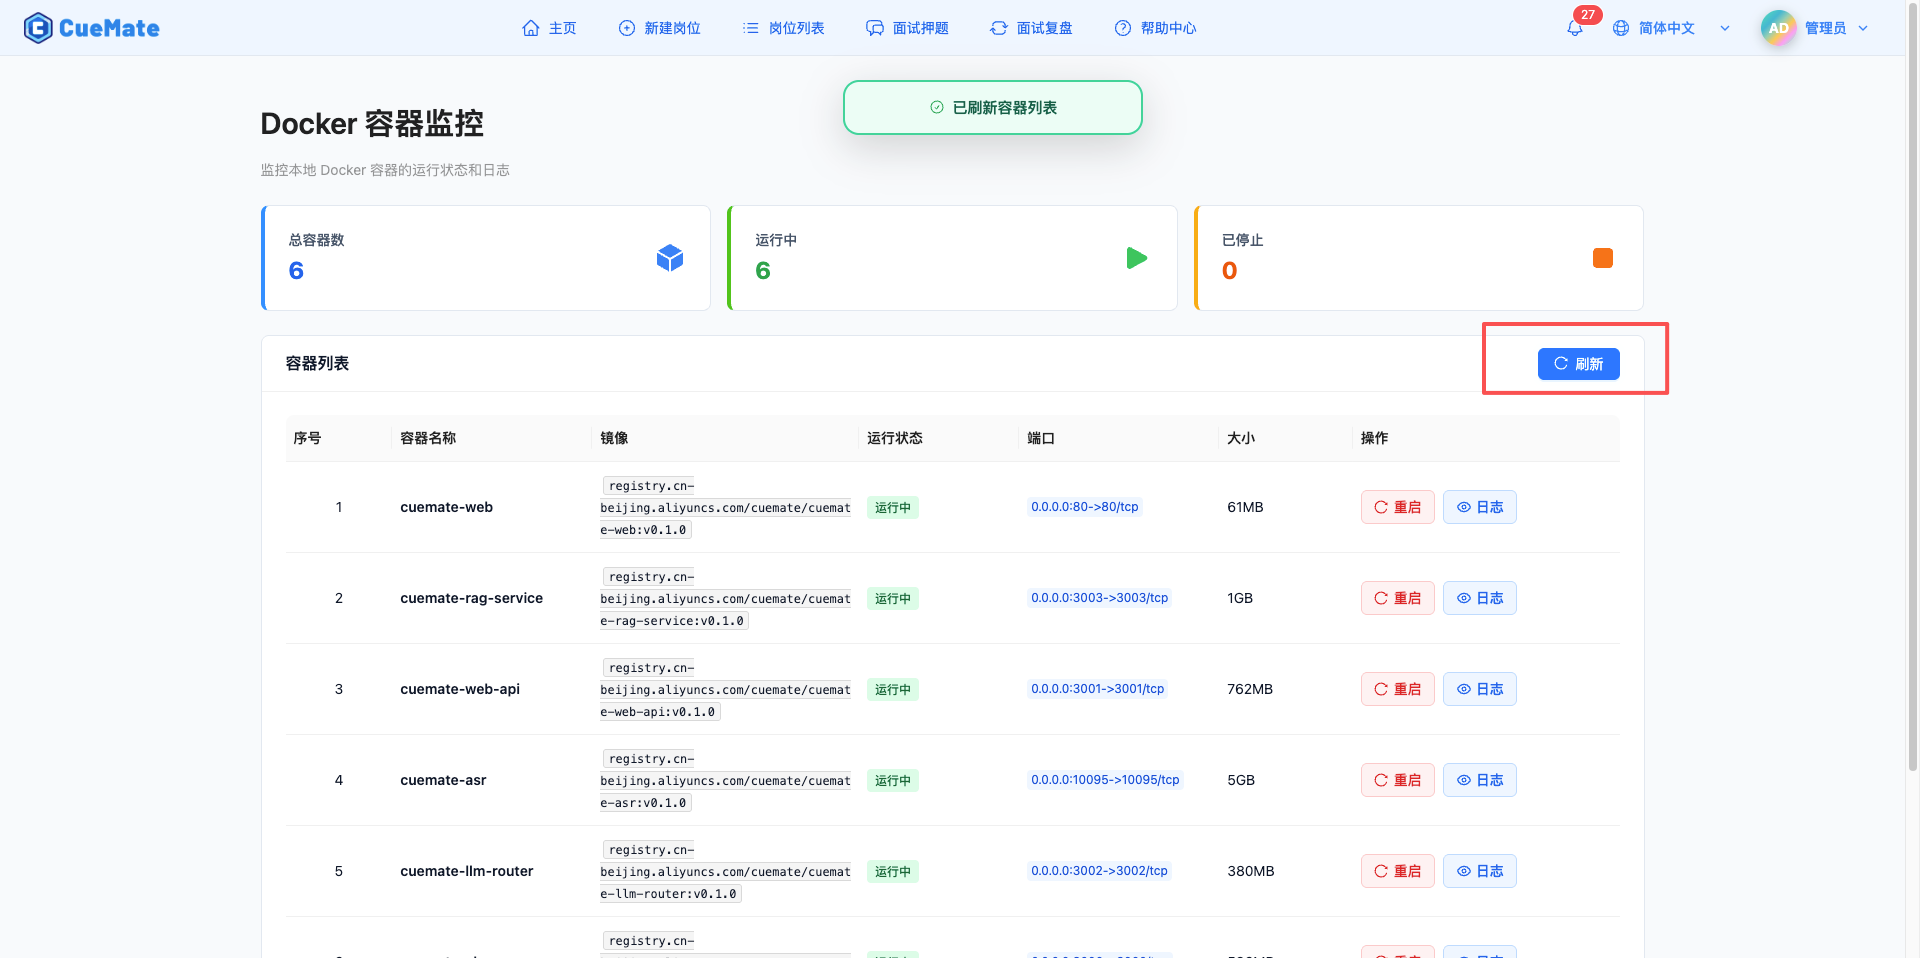
Refresh function:
- Retrieve the latest status of all containers
- Updated statistics card data
- After the refresh is completed, the "Container List Refreshed" prompt is displayed
- Show loading status when refreshing
Usage Scenario:
- View container status changes
- Verify that the restart operation was successful
- Check if the new container is started
- Confirm if the container is stopped
7.2 Automatic refresh
The system will automatically refresh the container list:
Refresh Strategy:
- Automatically refresh every 30 seconds
- Refresh silently without displaying prompt information
- Automatically update statistics and list content
- Stop automatic refresh after leaving the page
8. Container service description
8.1 Backend service container
The CueMate system uses the following Docker containers to provide services:
Web Services:
- cuemate-web - Main window service
- Port: 3004
- Provides main window service access
API Service:
- cuemate-web-api - Backend API service
- Port: 3001
- Provide business logic and data access
LLM Routing Service:
- cuemate-llm-router - Large model routing service
- Port: 3002
- Route and manage LLM requests
RAG SERVICES:
- cuemate-rag-service - Knowledge base search service
- Port: 3003
- Provide vector retrieval function
Speech Recognition Service:
- cuemate-asr - cuemate-asr speech recognition service
- Port: 10095
- Provide real-time speech to text function
Vector Database:
- cuemate-chroma - ChromaDB vector database
- Port: 8000
- Store and retrieve vector data
8.2 Service dependencies
Dependency Description:
- Web services depend on API services
- API service depends on LLM routing service and RAG service
- RAG service relies on ChromaDB vector database
- Desktop client relies on ASR speech recognition service
Restart Impact:
- Restarting the Web service does not affect other services
- Restarting the API service affects web and desktop clients
- Restarting the LLM routing service will affect the AI function
- Restarting the ASR service will affect the speech recognition function
9. Log viewing skills
9.1 Common log content
Normal log:
- Service startup information
- HTTP request log
- Database connection log
- Scheduled task execution log
Error log:
- Exception stack information
- Database connection failed
- Third-party service call failed
- Configuration error prompts
Performance Log:
- Request response time
- Database query time
- Cache hit rate
- Resource usage
9.2 Log analysis method
Positioning problem:
- Check the latest error log
- Search keywords (such as Error, Exception)
- Track request ID or user ID
- Analyze log time series
Troubleshooting steps:
- Determine when the problem occurred
- View the logs of the corresponding time period
- Locate error stack information
- Analyze the cause of the error
- Develop solutions
10. Best Practices
10.1 Daily monitoring
Recommended monitoring frequency:
- Check container status once a day
- Pay attention to the number of "stopped" containers
- Check container logs regularly
- Monitor container resource usage
10.2 Troubleshooting
Troubleshooting process:
- First check the statistics card to confirm the number of abnormal containers.
- Locate the exception container in the list
- Open the log pop-up box to view detailed logs
- Copy the log content for analysis
- Locate the problem based on the log content
- Try restarting the container to solve the problem
10.3 Log Management
Log viewing suggestions:
- Check each service log regularly
- Follow error and exception logs
- Copy and save important logs
- Analyze problems based on operation records
11. FAQ
11.1 Abnormal container status
Issue: Container shows "Exited" or "Stopped" status.
Solution:
- Check the container log and locate the reason for exit.
- Check whether the service in the container starts normally
- Verify that the configuration file is correct
- Try to restart the container to restore the service
- If the restart fails, check the detailed error message
11.2 Log loading failed
Question: Click the "Log" button, and the log content shows "Failed to obtain the log. Please check whether the backend service is running normally."
Solution:
- Check whether the Web API service is running normally
- Check whether the Docker service is normal
- Check if the container exists
- Refresh the page and try again
- Check the browser console for error messages
11.3 Failed to restart container
Problem: Clicking the "Restart" button prompts "Failed to restart container."
Solution:
- Check whether you have restart permission
- Check whether the Docker service is normal
- Check whether the container is occupied by other processes
- View the Web API service log
- Try to restart manually using the command line:
docker restart <container name>
11.4 Auto refresh not working
Problem: The container list is not refreshed automatically and needs to be refreshed manually to see the latest status.
Solution:
- Confirm that the page is not hung by the browser
- Check whether the network connection is normal
- Check the browser console for errors
- Refresh the page and reload it
- Clear browser cache
Related pages
- Log Management - View system operation log files
- Operation Log - View user operation history
- System Settings - Configure system parameters